


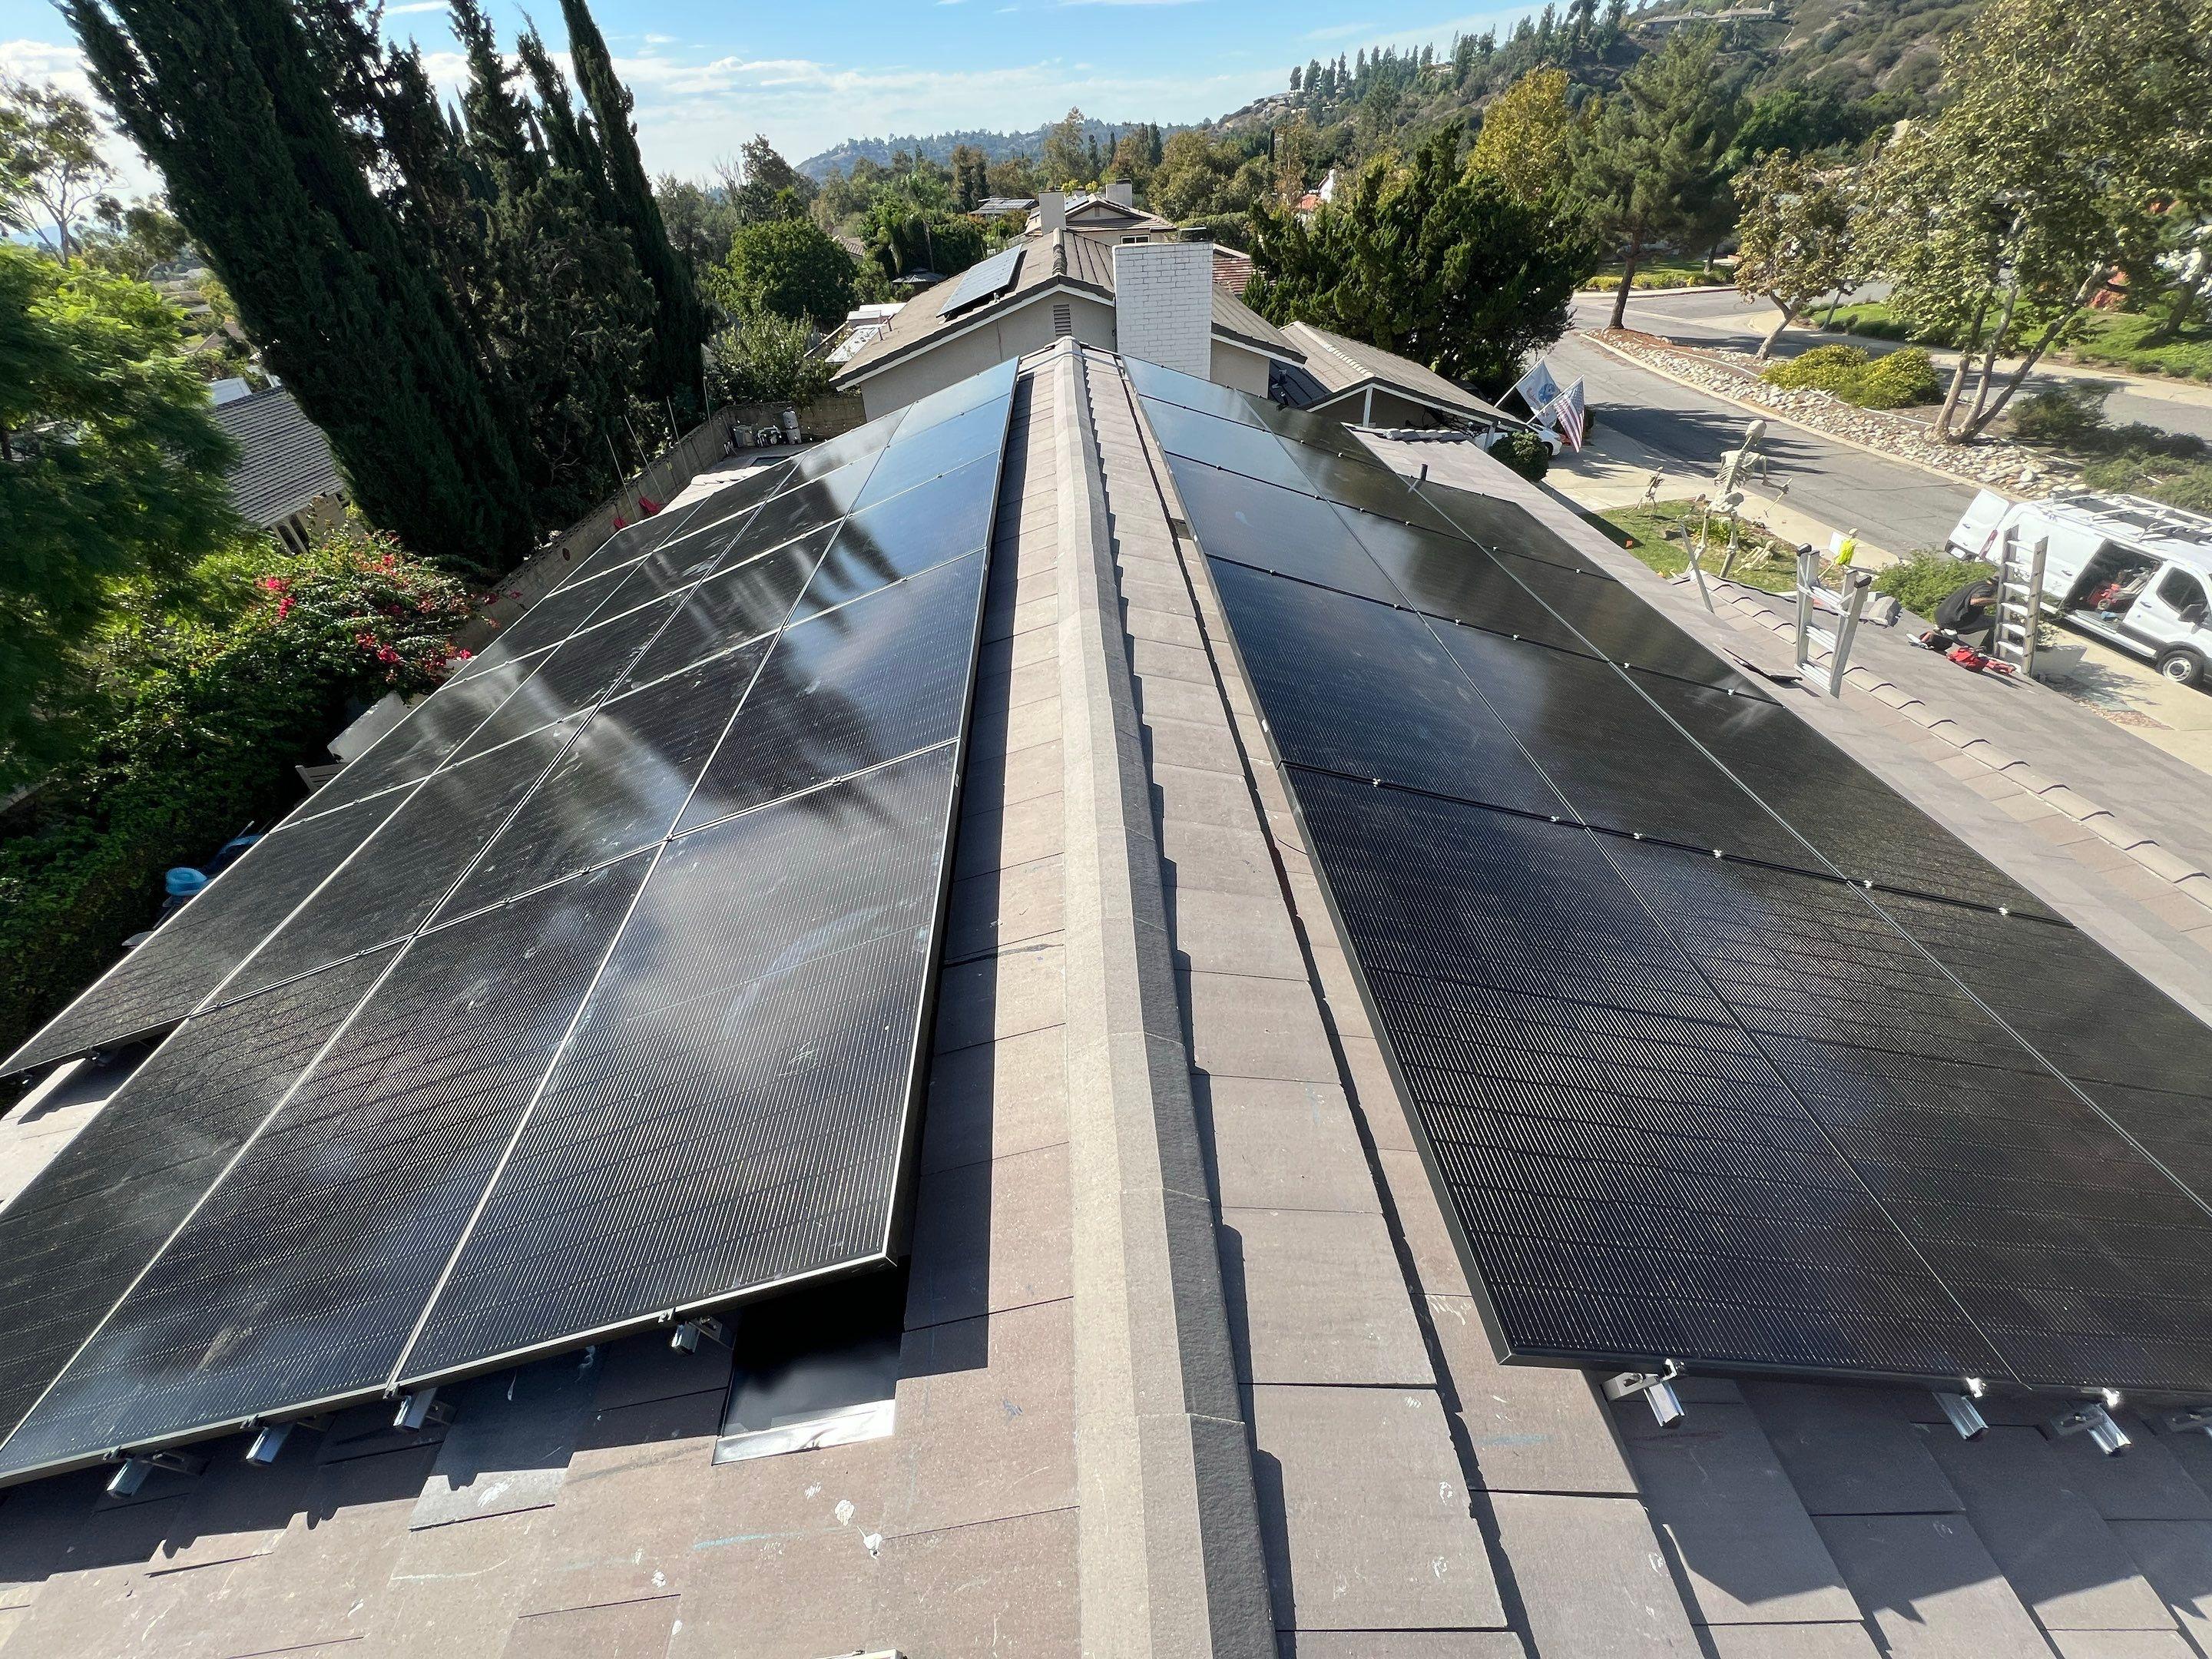
For SCE, LADWP, Glendale Water & Power, SDG&E and other Southern California utility customers.
You have panels on the roof. You expected a smaller bill. Now the amount due is higher than you remember. Start by finding out what changed.
Sources checked October 14, 2026.
The short answer: Solar reduces the electricity you need to buy, but a high bill can still come from evening grid use, higher household demand, reduced solar output, changed charges, or an annual settlement. A higher bill alone does not prove your panels have failed.
EL-FI's approach: Compare your latest bill with a bill from when your costs felt lower. Then check the billing details against what your solar and battery actually did.
Before blaming the panels, check what the bill is asking you to pay
The amount due is not always the cost of this month's electricity. It can include an unpaid balance, an adjustment or a settlement for an earlier period. A low previous payment might also have reflected a credit rather than unusually low energy use.
First, identify the electric utility, solar billing program and service dates on the statement. Don't assume every solar homeowner has the same arrangement. For a combined utility statement, separate electricity from water, gas, sewer and trash charges before judging solar performance.
| SCE billing example | What to check first |
|---|---|
| NEM 1.0 or NEM 2.0 | Check whether you pay net energy charges monthly or annually. Under annual billing, small monthly amounts due can coexist with energy charges accumulating for settlement. Review the year-to-date balance. |
| Solar Billing Plan Often called NEM 3.0 | Review monthly grid purchases and Energy Export Credits separately. An exported kilowatt-hour does not automatically cancel the cost of an imported kilowatt-hour. Annual settlement can also include credit adjustments. |
| Not sure | Bring the complete statement, including the rate and solar-detail pages, to your consultation. We can help identify which explanation applies. |
References: SCE's NEM bill guide and Solar Billing Plan bill guide.
Seven reasons your electric bill may still be high
The practical checks below apply across utilities. Where an example refers to SCE, use your own utility's tariff instead; a shared label such as "NEM" does not mean identical rules.
1. You buy electricity when your panels produce less
Your panels may produce well at noon while your household uses more energy after work. Air conditioning, cooking and EV charging can overlap in the evening. On SCE's Solar Billing Plan, TOU-D-PRIME applies; SCE identifies summer weekday hours from 4-9 p.m. as its highest-price period. Check your actual plan and season before changing schedules.
Look for: Grid purchases by time period. A full month of solar production does not reveal when you still needed the grid.
2. Your exported solar earns less than you expected
Solar Billing Plan export values vary with timing. Sending surplus energy out in the daytime and buying energy later can leave a bill, even when the exported and imported energy quantities look similar. NEM accounts follow different rules.
Look for: The actual export credit in dollars, alongside the charge for purchased energy. SCE explains how these charges and credits work.
3. Your home uses more electricity than it used to
An EV, longer AC operation, a pool pump, more people at home or a new electric appliance can change the picture. A heat pump replacing gas heating can increase electricity use while reducing gas use. To evaluate that change fairly, compare both fuels over comparable periods.
Look for: What changed at home between the two bills. Don't automatically assume more electricity means higher total household energy costs.
4. Your solar is producing less - or the app has stopped reporting
Seasonal sunlight, shading and equipment issues are possible explanations. Compare the solar app's production for the actual billing dates, preferably with the same season last year. A monitoring gap by itself does not confirm that generation stopped.
Look for: Missing days, equipment alerts or an unexplained drop in output. A utility meter records energy exchanged with the grid; it does not directly show all the solar used inside your home. Bills alone cannot diagnose a failed inverter. Ask the installer to check an unexplained production drop before buying more equipment.
5. You have a battery, but its operation doesn't match your expectations
A battery may preserve energy for backup, reach its discharge limit before the evening ends or have settings that need review. Check its charge level, reserve, operating mode and actual charge/discharge history. Reserve changes trade some outage readiness for more daily energy use; choose that trade-off deliberately.
Look for: Whether the battery supplied your home during expensive grid-use hours. Two bills alone cannot prove which setting is best.
6. Charges, rates or credits changed
Some charges remain even with solar. SCE's Solar Billing Plan guidance identifies a Base Services Charge and other taxes or fees that export credits cannot cover. Compare the lines on both bills rather than expecting a zero-dollar statement.
SCE also lists a rate change effective October 1, 2026. Its published average is not your personal rate: your tariff, timing and discounts matter. A previous California Climate Credit can also make one comparison month look unusually low. Check SCE's current rate advisory.
If a community choice provider appears on your statement, review its generation charges as well as SCE's delivery charges. Those separate sections are not automatically duplicate charges. SCE explains CCA billing here.
7. You're comparing different kinds of months
A mild spring month and a hot summer month are not a fair performance test. Neither are a 28-day bill and a 35-day bill. A new installation may also have only part of a billing cycle after permission to operate; verify the activation and billing dates if the system was recently installed.
Look for: Billing days, season, settlement status, credits and whether both bills cover the same service address. Start with the bill that concerns you, but use the same season last year when available.
Start with your utility: what deserves a closer look?
Why is my SCE bill high after solar?
Start with the NEM-versus-Solar Billing Plan distinction above. Review the amount due separately from current energy charges, then check time-of-use purchases, export credits and any settlement. If a community choice provider supplies your electricity, review its generation section too. A problem with evening grid use calls for a different response than a missing solar credit.
Why is my LADWP bill high after solar?
First isolate the electricity portion. LADWP also bills for water and, where applicable, city sewer and trash services. Solar electricity does not reduce water use or make sanitation fees disappear. LADWP's billing FAQ describes the usual residential cycle as approximately two months; check the actual dates and distinguish the service period from any monthly payment arrangement.
LADWP has its own NEM rider. It provides for eligible credit balances to carry forward, with taxes and minimum charges excluded from that offset. Do not apply SCE's Solar Billing Plan export-credit assumptions to an LADWP account. Check remaining electricity charges, the credit balance, your rate schedule and whether any usage was estimated or a bill covers an unusual period.
Sources: LADWP billing FAQ and LADWP NEM rider.
Why is my Glendale Water & Power bill high after solar?
Find the electric-service section and identify your rate schedule before comparing the total amount due. GWP publishes its own NEM program and residential customer-owned-generation rates, including L-1-D. Its rate information lists a customer charge as well as energy charges. Check your actual schedule, solar credits, billing days and adjustments; do not assume a bill credit eliminates every charge.
If your statement also contains water or other city services, compare those separately. A higher combined payment is not, on its own, evidence of a solar problem. Confirm missing credits or unexplained adjustments with GWP using your account's interconnection agreement and billing details.
Sources: GWP NEM program and residential electric rates.
Why is my SDG&E bill high after solar?
Check whether you are on NEM or the Solar Billing Plan. SDG&E's NEM guide tracks a 12-month period and annual true-up. Its Solar Billing Plan bills grid imports and credits exports monthly. Review your own time-of-use periods, credit values and charges rather than substituting SCE rates.
If San Diego Community Power or Clean Energy Alliance supplies your electricity, the provider sets generation import charges and generation export credits under the Solar Billing Plan. Review that section alongside SDG&E delivery charges. Where your statement includes gas, keep gas costs separate from the solar-electricity comparison.
Sources: SDG&E NEM bill guide and Solar Billing Plan.
What about Burbank, Pasadena, Anaheim, Riverside or another utility?
Tell us your provider when you request a consultation. We will first identify the applicable rate and solar agreement from your documents. This guide does not assume those utilities share SCE's export credits, settlement rules or battery economics. If the provider or agreement changed between bills, we flag that before drawing conclusions.
Have a high bill and an older lower one? Bring both. EL-FI can help separate billing changes, usage changes and questions about system performance.
Why electricity costs more: Southern California prices from 2020 to 2026
Solar can reduce how much electricity you buy, while the electricity you still buy becomes more expensive. That is one reason a working solar system and a higher utility bill can exist at the same time.
Our calculations from federal utility data show that the average residential electricity price rose between 2020 and 2025 by about 73% at SCE, 79% at SDG&E, 28% at LADWP and 68% at Glendale. The year-to-year path was uneven: SCE's annual average dipped in 2025, and other utilities also had declining years. A long-term increase does not mean every rate change raises your bill.
What the charts measure: reported bundled residential electricity revenue divided by residential electricity sales, in cents per kWh. These are annual averages across customers, including the effects of customer mix and reported billing credits - not peak-hour prices or an individual solar customer's tariff. They exclude separately supplied CCA/direct-access accounts and water, gas, sewer and trash. Prices are nominal, without inflation adjustment. Source: EIA-861 annual data, 2020-2025; calculations by EL-FI.
2026 status: as of October 14, 2026, the year is incomplete. EIA's latest final annual utility dataset is 2025. The historical charts mark 2026 as unavailable; the separate outlook below uses a labeled CEC forecast. No full-year 2026 actual or standalone municipal forecast has been invented.
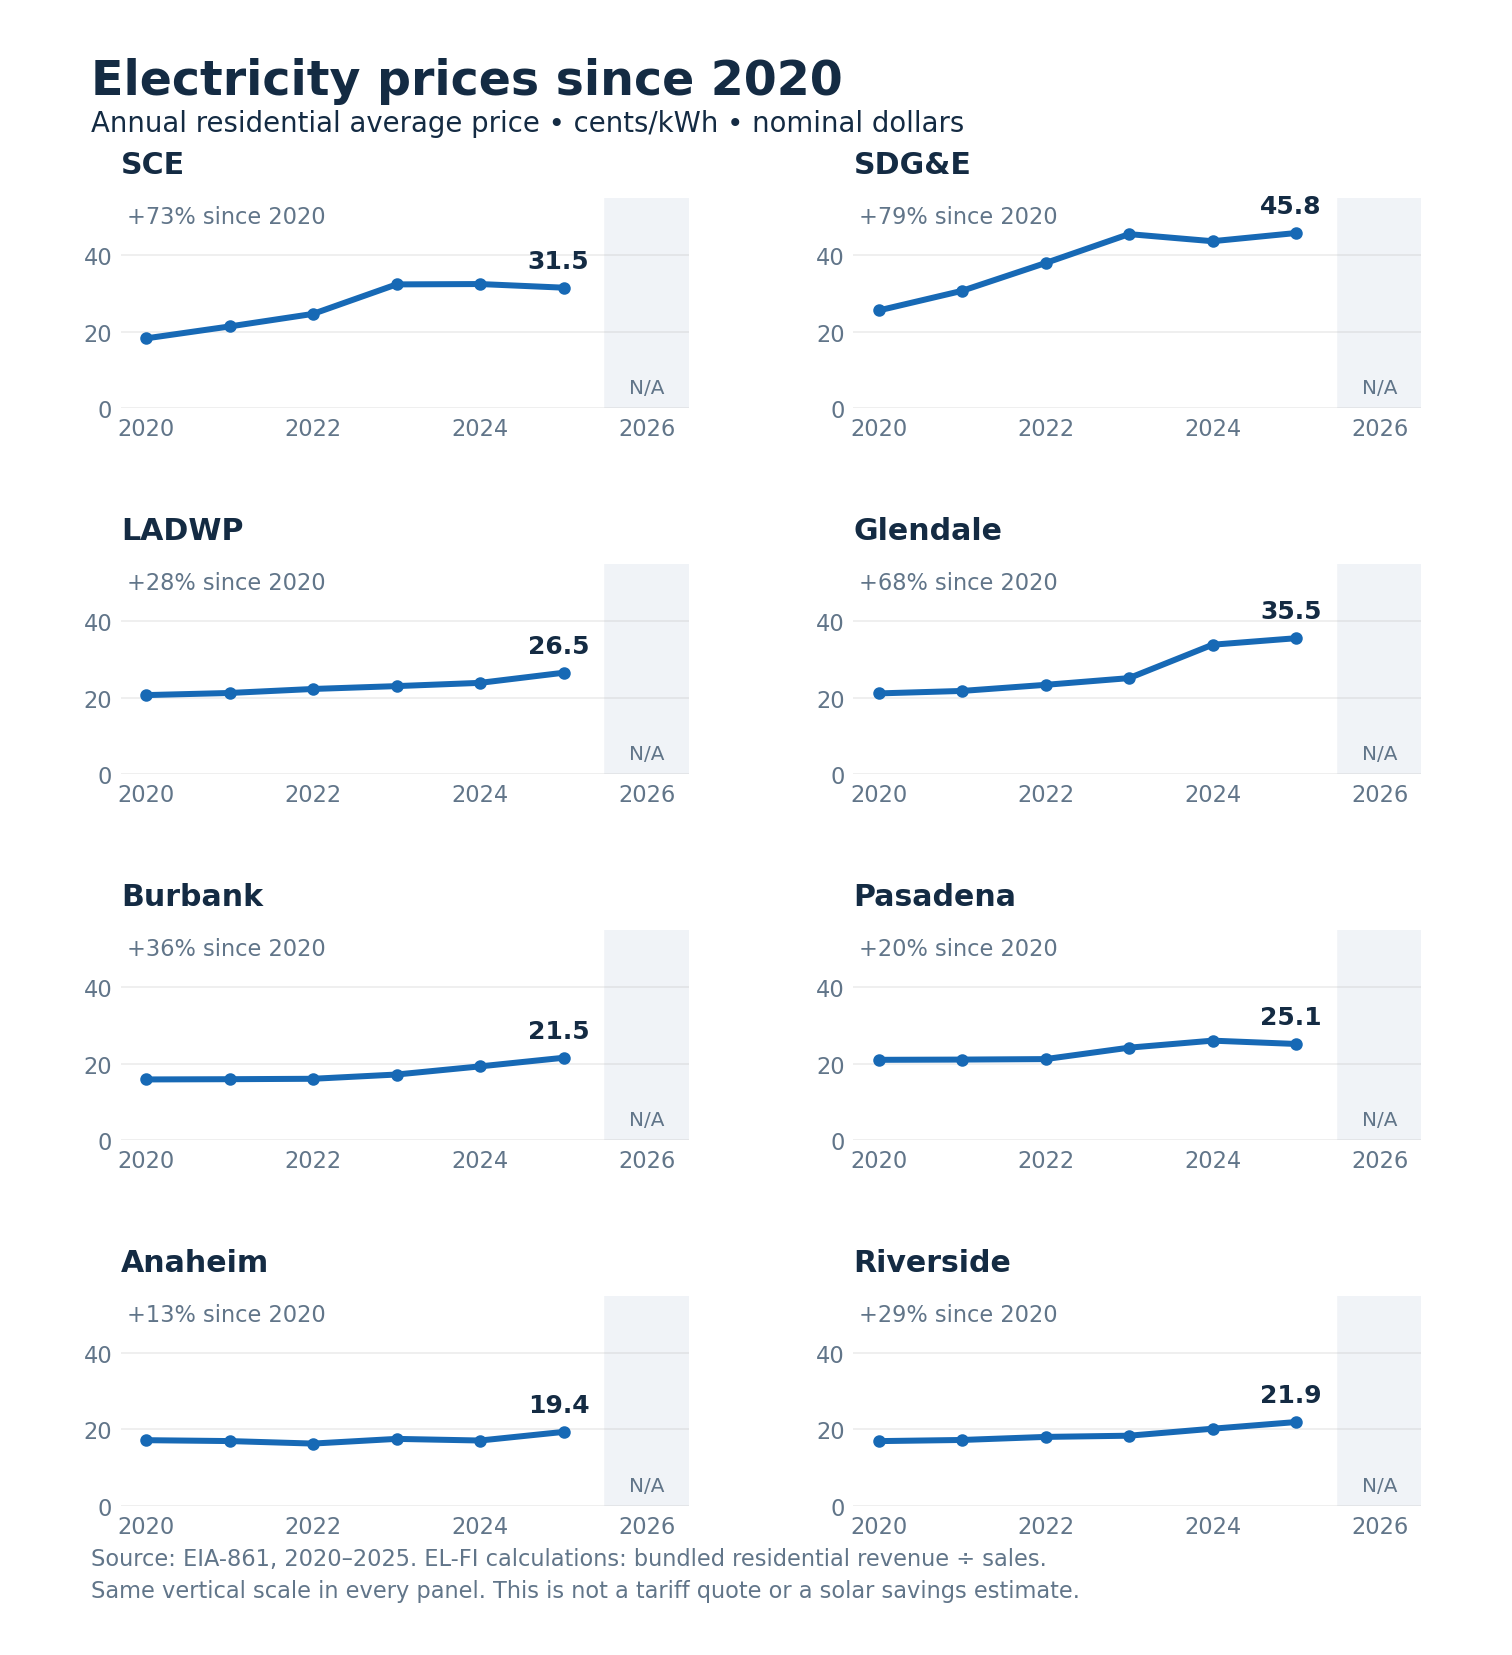
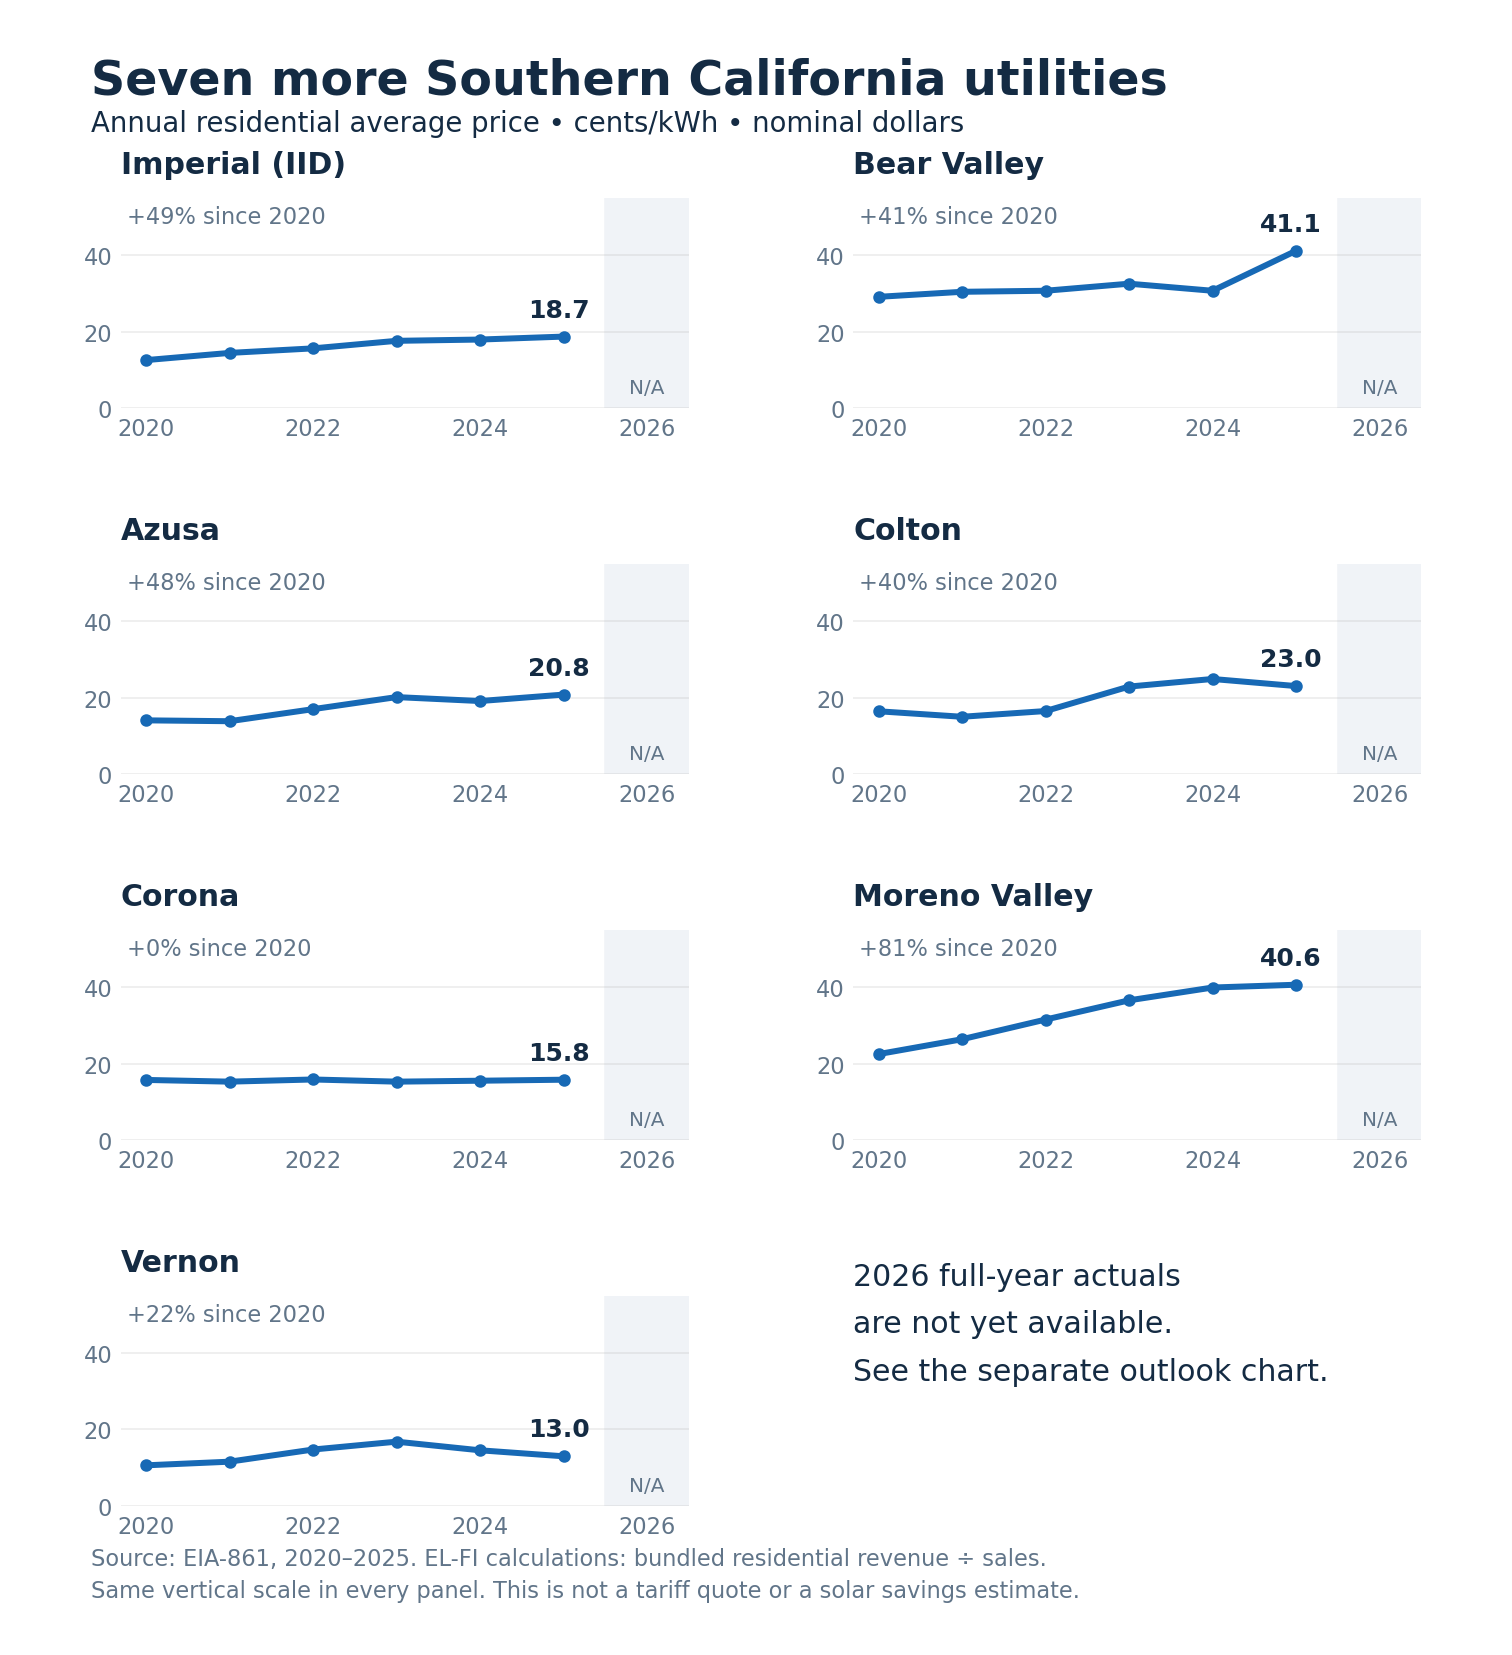
Coverage: 15 selected Southern California electric utilities with comparable residential observations for all six completed years. This is not every local utility, cooperative or community choice provider. Corona and Moreno Valley municipal service covers only part of those cities; Vernon has a very small residential customer base. Confirm the provider printed on your bill.
See every annual price and the percentage change
| Utility | 2020 | 2021 | 2022 | 2023 | 2024 | 2025 | Change |
|---|---|---|---|---|---|---|---|
| SCE | 18.22 | 21.33 | 24.62 | 32.33 | 32.43 | 31.48 | +72.8% |
| SDG&E | 25.51 | 30.65 | 37.92 | 45.48 | 43.63 | 45.77 | +79.4% |
| LADWP | 20.63 | 21.19 | 22.24 | 22.99 | 23.84 | 26.48 | +28.4% |
| Glendale | 21.08 | 21.73 | 23.32 | 25.08 | 33.81 | 35.51 | +68.5% |
| Burbank | 15.83 | 15.90 | 16.01 | 17.12 | 19.25 | 21.50 | +35.8% |
| Pasadena | 20.96 | 21.03 | 21.16 | 24.14 | 25.98 | 25.11 | +19.8% |
| Anaheim | 17.20 | 16.97 | 16.31 | 17.54 | 17.11 | 19.37 | +12.6% |
| Riverside | 16.95 | 17.26 | 18.06 | 18.37 | 20.20 | 21.94 | +29.4% |
| Imperial (IID) | 12.54 | 14.42 | 15.60 | 17.58 | 17.91 | 18.69 | +49.0% |
| Bear Valley | 29.08 | 30.40 | 30.67 | 32.52 | 30.67 | 41.12 | +41.4% |
| Azusa | 14.03 | 13.81 | 16.96 | 20.12 | 19.08 | 20.77 | +48.0% |
| Colton | 16.41 | 14.97 | 16.46 | 22.87 | 24.85 | 23.00 | +40.2% |
| Corona | 15.71 | 15.25 | 15.82 | 15.25 | 15.50 | 15.76 | +0.4% |
| Moreno Valley | 22.46 | 26.34 | 31.49 | 36.52 | 39.87 | 40.60 | +80.8% |
| Vernon | 10.62 | 11.58 | 14.75 | 16.81 | 14.55 | 12.99 | +22.3% |
All annual prices are cents/kWh; change compares 2020 with 2025, using unrounded values. Full-year 2026 actuals are unavailable for every row. Formula: revenue in thousand dollars ÷ sales in MWh × 100.
What do higher prices mean for a home with solar?
An illustration, not a savings quote: buying 300 kWh at 20 cents costs $60 in energy charges. Buying the same 300 kWh at 35 cents costs $105 - a $45 increase with no extra electricity use. Fixed charges, credits, time-of-use pricing and solar exports change the actual bill. We need your two statements to determine which of these changed at your home.
What is happening in 2026 - and what is on the horizon?
SCE's October 1, 2026 advisory lists an average residential rate of 34.5 cents/kWh before the Climate Credit, up from 34.4 cents immediately beforehand. This is a current rate snapshot, not a completed-year average and not directly interchangeable with the EIA series. Read SCE's current advisory.
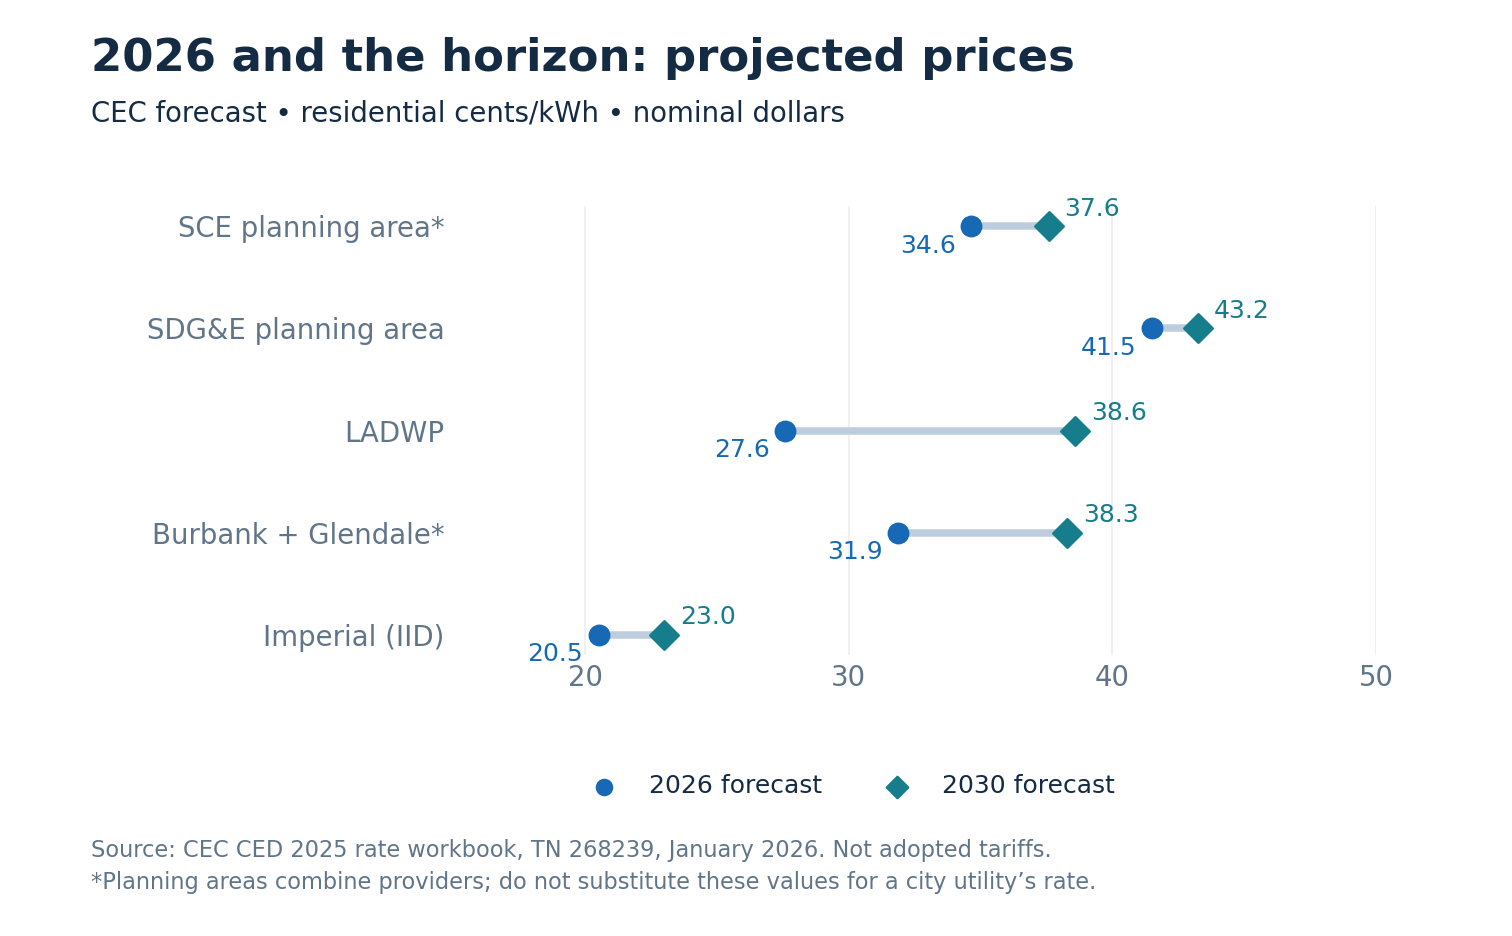
The California Energy Commission's January 2026 rate forecast provides a consistent planning outlook. The numbers below are projections, not approved future tariffs. They were prepared before the latest completed-year EIA release, and actual rate decisions, credits and costs can differ.
| CEC planning area | 2026 forecast | 2030 forecast | 2035 forecast |
|---|---|---|---|
| SCE planning area* | 34.65 | 37.58 | 40.52 |
| SDG&E planning area | 41.51 | 43.24 | 45.60 |
| LADWP | 27.59 | 38.60 | 47.70 |
| Burbank + Glendale* | 31.88 | 38.28 | 43.31 |
| Imperial (IID) | 20.52 | 22.98 | 26.00 |
Cents/kWh, nominal dollars. The SCE planning area includes SCE bundled, CCA and direct-access customers plus several municipal utilities, including Anaheim, Pasadena and Riverside. Burbank/Glendale is a combined area; its forecast is not an individual forecast for either city. SDG&E's area includes CCA and direct-access service. LADWP and IID are separate planning areas. Do not splice these projections onto the EIA utility lines. Source: CEC CED 2025 rate workbook, "1. Planning Area Rates" and "5. Planning Area Definition."
Costs to watch include purchased power, grid maintenance and expansion, wildfire safety and financing. The CPUC reviews investor-owned utility rates; municipal rates are set locally. More demand alone does not establish how fast rates will rise. New customers and higher sales can help spread fixed costs, while new infrastructure can add costs. CPUC: Understanding electric rates.
Is electricity demand rising too?
Yes over the recent period shown, though not every year. California's electricity consumption increased from 271.8 TWh in 2020 to 281.0 TWh in 2024, about 3.4%. It fell in 2023 before rising again in 2024. The CEC baseline forecast projects 288.9 TWh in 2026, 322.3 TWh in 2030 and 417.6 TWh in 2045. The 2030 projection is about 14.7% above 2024; the 2045 projection is about 48.6% above 2024.
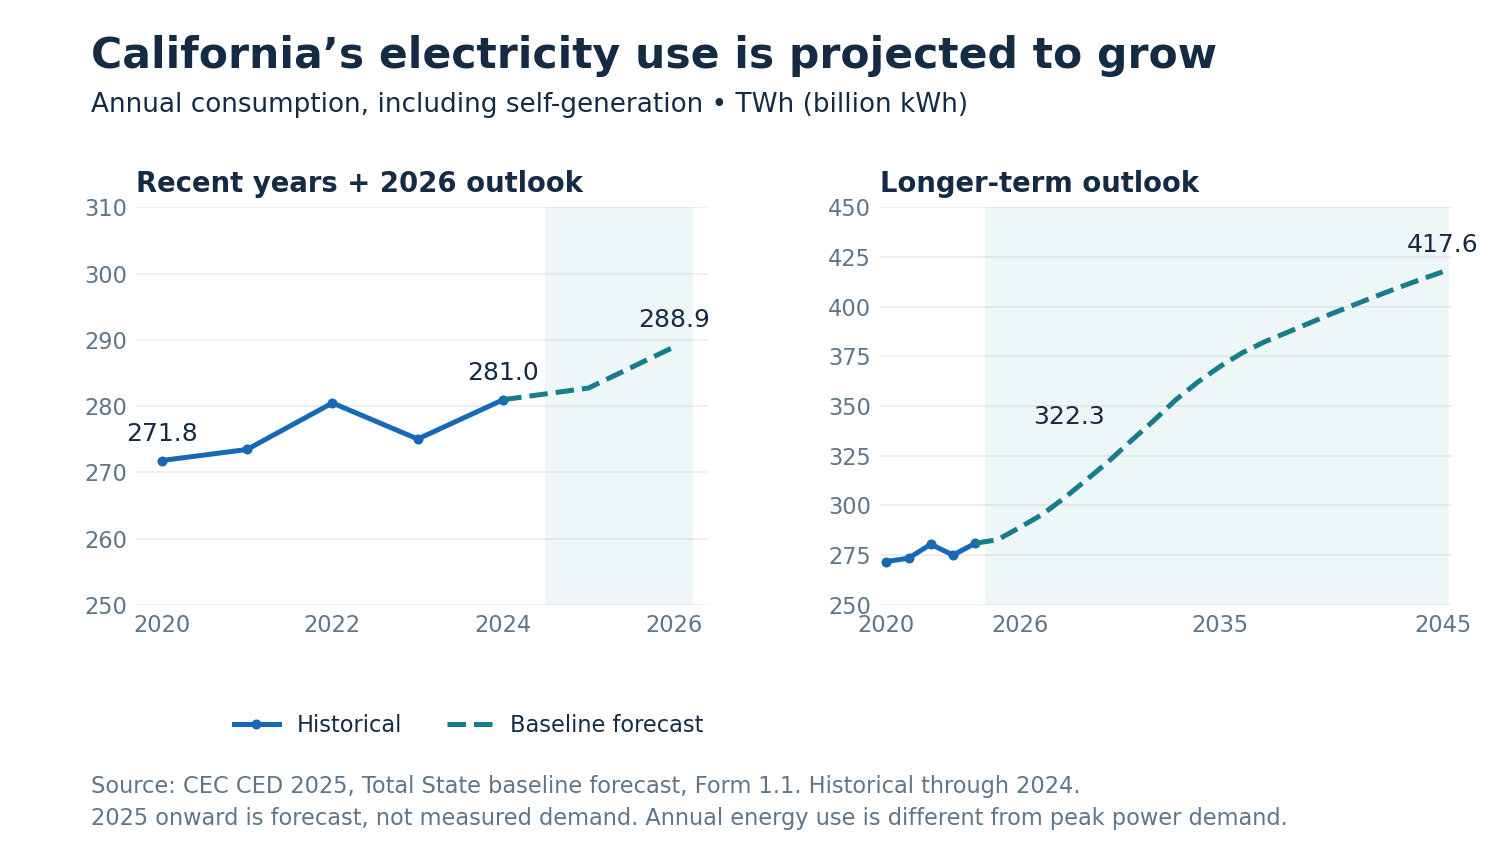
Electric vehicles, electric appliances and building systems, and data centers are factors in the CEC's demand outlook. Weather, efficiency and the timing of new loads also matter. The forecast is a scenario for planning, not a guarantee that demand or your bill will follow that path.
Source: CEC CED 2025 Total State baseline forecast, Form 1.1, adopted January 21, 2026. This series includes self-generation, including power used behind the meter. One TWh is one billion kWh. Annual energy consumption is different from peak power demand in MW; the chart does not show peak capacity or Southern California-only demand. Forecast scope and assumptions.
What should a homeowner do with this information?
Use it as a reason to review your own numbers. Check your rate plan, when you import power, whether solar production changed, and which charges solar cannot offset. A battery may help shift electricity use, but its value depends on your tariff, export credits, usage and installed cost. A regional forecast is not enough to recommend equipment.
Let's compare what changed at your home. Request a no-cost consultation and bring your latest electric bill and an older lower bill. We will start with your utility, your billing period and your solar program.
The comparison that actually helps
Our review starts with five questions. Missing information stays marked as unknown until it can be confirmed.
| Question | What we compare |
|---|---|
| Is this a fair comparison? | Utility, dates, days, address, season and whether the older bill is before or after solar. Identify changes of provider or account. |
| What is the charge for this period? | Electricity charges, export credits, fixed charges and taxes, separated from old balances, payments, settlement adjustments and any water, gas, sewer or trash charges. |
| Did grid use change? | Imported and exported kWh where separately reported, plus comparable daily averages and time-of-use detail. Net usage is not treated as gross imports. |
| Did pricing change? | Rate plan, generation provider, discounts and unusual credits. |
| What needs a closer look? | Changes at home, solar production records and battery history, when available. |
A larger total does not always mean more daily use
Imagine an earlier statement shows 300 kWh imported over 30 days. A later statement shows 350 kWh imported over 35 days.
Both equal 10 kWh of grid imports per day. The larger total is explained by the longer period. If cost per day also rose, the next checks are pricing, timing and adjustments. This normalization does not account for weather or prove solar performance.
What should you do next?
Start with the cause. A schedule change may help with evening imports. A production fault needs troubleshooting. A settlement balance needs an explanation of the billing cycle. A battery proposal needs a comparison using your actual loads, tariff and installed cost.
A high bill is a reason to investigate, not an automatic reason to buy a battery or more panels. Before expanding an older solar installation, verify how the proposed change would affect its utility agreement. For a broader starting point, read our Southern California home-battery guide.
Let's find out what changed.
Bring your latest electric utility bill and an earlier bill from when your costs felt lower. Request a no-cost consultation with EL-FI Homes to discuss the difference and sensible next steps.
No purchase required. This initial bill review and consultation do not include an on-site inspection, repair or guarantee of savings. EL-FI is an independent contractor and is not affiliated with your utility.
What your consultation will cover
- What the available bills show changed, and whether they are comparable.
- Likely explanations and any missing information needed to confirm them.
- Practical next steps, including whether to ask your utility, your generation provider or your solar installer for help.
Two bills provide a starting point. A full savings or equipment recommendation may require 12 months of bills, interval usage and solar or battery monitoring records.
Questions homeowners ask
Can my solar work properly and still leave a high electric bill?
Yes. The home can still need grid electricity, especially when solar output is low. Usage, timing, rates and billing adjustments all need to be checked alongside production.
Why was last month's amount due small but this month's is large?
Check for an annual settlement, an old balance or a credit on the earlier bill. For NEM annual billing, review the accumulated energy balance, not only the monthly amount due.
Can you tell whether my solar is broken from two bills?
Not conclusively. Bills can flag a change that deserves investigation. Confirming an equipment issue generally requires production history, equipment status and, where appropriate, a professional inspection.
Should I compare a bill before solar or after solar?
Either can start the conversation. An earlier post-solar bill helps investigate a change; a pre-solar bill provides a different baseline. We identify which one you supplied and account for dates, pricing and household changes.
Do I have to buy anything to get the consultation?
No. The initial bill review and consultation are at no cost. If a paid inspection, repair or installation is recommended, its scope and price would be discussed separately before you agree to any work.
Can I get help if another company installed my solar?
You can request the bill-review consultation. Equipment access, existing warranties and the installer's responsibilities may affect the next steps. Don't share monitoring passwords; we can discuss appropriate access if it becomes necessary.
About the author
Uday Singh leads EL-FI Homes and brings experience in clean-energy product management to homeowner education. He holds an MS in Alternative Energy Science from Arizona State University and an MBA from UCLA Anderson and is a former clean-energy product management leader. EL-FI coordinates solar, battery, HVAC and electrical work across Los Angeles, Orange, Riverside and San Bernardino counties. Learn about EL-FI Homes.
Further SCE reading: Understanding your NEM bill | How the Solar Billing Plan works | Guide to your Solar Billing Plan statement | Current rate advisory | Community Choice Aggregation billing